$5 shipping for (almost) all of New Zealand*
A Boring® Report about Growing Oats in New Zealand
Environmental Impact Assessment of Oat Milk Production at the Farm Level
Prepared for Leftfield Innovation Ltd for Boring Oat Milk
Prepared by The AgriBusiness Group
November 2022
Last year, Boring® commissioned a report by Leftfield Innovation looking at the environmental impact of oat milk production at the farm level in New Zealand, and to explore how an oat crop could complement a local regenerative agricultural system.
View the full report below or click here for a download of the report.
Can’t be bothered reading the full thing? Here’s the Cliffs Notes version:
When comparing New Zealand arable and dairy farm systems in Otago and Southland – where the large majority of oats are grown – the report showed that:
* In terms of land use, growing oats is much more efficient than dairy – oats require 70% less land to produce 1L of milk.
* The on-farm greenhouse gas (GHG) emissions to produce oats for 1L of oat milk is 93% less than to produce 1L of dairy milk.
Addition of 10% of oats into a traditional dairy farm system;
* Would require 21% less land;
* GHG emissions would be reduced by 7%, however…
* Financial return would be also 12% less
Other takeaways:
* It would be relatively easy for an oat production system to fit into a regenerative farming framework.
* A full dairy farm system offers twice the return of the highest earning arable model – but as demonstrated elsewhere in the report, at a much higher cost to the environment.
* The considerably higher returns from dairy mean that the only justification for combining this land use with oats would be the reduction in GHG i.e. putting the planet before profits.
Executive Summary
The AgriBusiness Group (TAG) has been requested by Leftfield Innovation Ltd (LIL) to act as a subcontractor to LIL in providing an Environmental Impact Assessment (EIA) of Oat production at the farm level for Boring Oat Milk. The oats that are used in the production of Boring Oat Milk are all sourced from arable growers in Southland.
Literature Review
We undertook a literature review of the international literature to understand and gauge the level of environmental impacts of different milk products during the production phase. We then used a modelling approach using Overseer to understand the potential environmental impacts from an oat crop across four farm systems.
From the literature review we determined that there were four key environmental impacts:
1. Nutrient loss.
2. Water abstractive use.
3. Land area used.
4. Greenhouse Gas Emissions.
Plant based milks have been found to generally have a lower environmental impact compared to animal based milk.
Poore’s work is the most informative and he found that the farm stage dominates the environmental impacts with the vast majority of impacts. He concluded that though producers are a vital part of the solution, their ability to reduce environmental impacts is limited. He then went on to construct a framework which represents the possible range of mitigation possibilities and he concludes that in adopting his framework the following outcomes would be seen:
* Producers would monitor their impacts using digital tools.
* Data would be validated against known ranges for each value (e.g., maximum yields given inputs) and validated which would support producer-led innovation.
* Impacts would be communicated up the supply chain and through to consumers.
* Consumers would then drive reductions in the five areas of concern by making their choices in buying the products which gave the least amount of environmental degradation.
Regenerative Agriculture
In a think piece funded by Our Land and Water Toitū te Whenua, Toiora te Wai National Science Challenge (OLW) the authors recognise that the concept of regenerative agriculture in terms of its definition are fluid and are numerous and depend very much on the place and culture which they
are considering it in. They then went on to identify a wide range of themes that would make a system regenerative which ranged from social well being to resilience. What we can see from this range of themes is that the concept of regenerative agriculture is more of a loose theory about what is a worthwhile farming philosophy that is going to result in the farming system being more sustainable rather than the sort of strict adherence to a set of practices as we find within the organic or bio grow industries.
We conclude that it would be relatively easy for an oat production system to fit into a regenerative farming framework as long as the farmer was willing to set up his system to achieve the themes identified in Table 3 and the descriptions that are provided in Table 4. We are not of the opinion that this would be an arduous or difficult task for the majority of oat growers who are already achieving a lot of the themes within their current systems.
Modelling
We have modelled three environmental impact indicators using Overseer:
* land use (litre / m2)
* GHG ( T CO2 eq / ha)
* Phosphorus Loss ( kg P / ha).
There are five farm systems modelled.
* An intensive arable system,
* A Southland mixed arable/ livestock system Autumn sown,
* A Southland mixed arable/ livestock system Spring sown,
* A Southland dairy farm system,
* A dairy farm system plus 10% oats.
The results of this modelling are:
* The land use of oats is far more efficient in output than dairy is when considered on a per litre of output basis.
* The farming of plant based systems are obviously much lower than the animal based systems in terms of GHG emissions.
* The loss of P is lower in the arable systems than in the livestock systems.
Financial Model
* The Intensive arable model is the highest returning of the arable models because of the higher proportion of higher returning crops than livestock.
* The Autumn sown arable model has higher returns than the Spring sown because the higher returns from the crops in that model outweigh the higher returns from livestock.
* The straight Dairy model is twice the return of the highest earning arable model with the Dairy / Oats model being almost 50% higher.
* The considerable higher returns from Dairy mean that the only justification for combining this land use with oats would be the reduction in GHG.
1 Background
The AgriBusiness Group (TAG) has been requested by Leftfield Innovation Ltd (LIL) to act as a subcontractor to LIL in providing an Environmental Impact Assessment (EIA) of Oat production at the farm level for Boring Oat Milk. The oats that are used in the production of Boring Oat Milk are all sourced from arable growers in Southland.
1.1 The Task
The tasks that TAG have been asked to carry out are:
Milestone 1
Report on the environmental impacts of different milk products during the production phase – emissions, nitrate losses, water use, biodiversity, soil. With a proposal on how oat milk can fit into a regenerative agriculture system.
Milestone 2
Report showing inputs and GHG losses for oats.
Milestone 3
Model showing inputs and losses for the 3 farm systems. The three farm systems nominated are oat production in an arable system in Southland, dairy and a combination of dairy and oat milk production. TAG have represented oat production in an arable system in Southland by utilising an existing model of an intensive system and a more usual arable and livestock mix.
Milestone 4
Financial model showing costs and profit for the 3 farming systems. Have provided TAG with further clarification of what they were after in this EIA as:
Impact per L
We want to know the following per tonne of oats;
* Carbon Emissions
* Water Use
* Land Use
We will then calculate what that means for 1L of oat milk. We also want to compare this to 1L of dairy milk so whatever is the best metric to give us the same information for dairy milk. Impact per hectare for oats, dairy and a mixed farming model of oats/dairy.
* Carbon Emissions
* Water Use
* Yield / land use
* Soil Health
Commercial
* Return on oats per hectare.
* Return on dairy per hectare (now and building scenarios for when the emissions trading scheme comes into effect in 2025).
* Return on a mixed farming model (oats and dairy)
* Showing a scenario with the ideal crop rotation on a piece of land over three years (the typical time between replanting a crop of oats on the same hectare). What other crops could you grow that would give a better commercial outcome for the grower. Look at it across the three years and then calculate as an average for one year.
Regenerative Agriculture
Can oats help prevent soil degradation and what are ways that oats can be grown that are regenerative?
1.2 Methodology
Our methodology was:
We undertook a literature review of the international literature to understand and gauge the level of environmental impacts of different milk products during the production phase. This review collected information on:
* Greenhouse gas emissions
* nutrient losses below the rooting depth of the crop and across the surface
* abstracted water use
* biodiversity
* the amount of land required to produce the product
* the fit of oat milk production into a regenerative agriculture system
We then used a modelling approach using Overseer1 to understand:
* The potential GHG losses from an oat crop that can be modelled using a carbon calculator operating at the crop level. This modelling can also demonstrate the major activity contributors to the emissions profile.
* Use a modelling approach to compare the losses from three farm systems; an arable farm growing oats with sheep in the system, an integrated dairy farm with an area (5% of farm) in oats each year and a dairy farm.
We then undertook some economic modelling to understand the financial performance of the five farm systems above, taking into account the costs that will incur from the emissions trading scheme coming into effect for farms in 2025.
1See Appendix A for a brief discussion on Overseer.
2 Literature Review
This literature review looked at the environmental impact of the production phase of different milk products which was taken from the available research literature.
2.1 Introduction
Global agriculture feeds over 7 billion people but is also a major cause of environmental degradation, including nutrient loss (nutrients to water), water use, greenhouse gas emissions, biodiversity impacts, and soil loss. The increase in consumer demand for sustainable food has opened up a market for alternative food types. This has been significant in the milk industry, with a multitude of alternatives that offer an alternative to dairy derived milk, the majority of which are plant based. A large body of research suggests that a more plant-based diet is needed to lower human-induced climate change and environmental impacts on land and water.
This literature review analysed the life cycle assessments (LCAs) to compare the environmental and climatic impact of a range of milk alternatives. LCAs evaluate the effects a product has on the environment over the entire period of its life from production through to processing and then consumption, thereby increasing resource-use efficiency and decreasing liabilities. It attempts to incorporate the environmental impact of the means of production, machinery and infrastructure used in the production and processing and distribution of the milk. It should be noted that LCA follows a general five-stage process, however, can yield different results depending on methodological choices.
It should also be noted that this report only includes the direct environmental impact of the farm based production and does not include the typical LCA impact assessment. It is the author’s opinion that the methodology used in this study offers a valid comparison between the alternative milk products at the farm level. ultiple literature reports were reviewed in brief to discover what research have been completed of milk to compare their environmental impact. It should be noted there were few studies completed on the LCA of oat milk production, with more focus on soy and almond milk alternatives. There were also limited studies on production impact on biodiversity and soil.
2.2 The five main factors causing environmental loss from the production of milk products.
2.2.1 Nutrient loss
Nutrient loss is an increase in the nutrients (nitrogen and phosphate) available in a waterbody which can subsequently degrade water quality, including algal blooms and aquatic dead zones. The potential for nutrient loss varies with cultivation, both type and timing, fertilizer application, soil type, irrigation, and rainfall.
Silva and Smetana2 found in their literature review that animal milk has the highest impact on freshwater contamination with cow milk emitting 0.00035 - 10.65 kg P eq. / L milk, followed by rice milk (4.69 kg P eq.), with oat milk emitting 1.62 kg P eq. Poore and Nemecek3 found similar results with soy milk emitting 6% of the nutrient loss substances that occur during dairy milk production. In some cases, cereal nutrient loss was higher than that of dairy production (Clark and Tilman4) although this study compared organic vs conventional farming and did not directly compare different food sources to one another.
2.2.2 Water Use
Poore and Nemecek estimated that two-thirds of freshwater withdrawals, worldwide, are for irrigation. This varies with rainfall and crop requirements. Table 1 shows that almonds require the most water per litre of milk produced, due to irrigation requirements of almond trees in California. This was also reflected in Buchan’s5 findings of Almonds having 9% higher water use compared to dairy, and a 600% higher water use compared to Oats. Buchan’s study also found that oats have a higher water use than Pea and Coconut. It should be noted that the farms reviewed in these studies predominately are in the USA which has different management systems and climate to that found in New Zealand. This is particularly so for Almond milk which is grown in a very low rainfall area that requires a large amount of irrigation.
.jpg?v=1675285454201)
Table 1: Water use per litre of milk (L of Water/L of Milk)
2.2.3 Land Area
Within New Zealand, a total of 1.9 million hectares is used for agricultural purposes. Land area varies between milk products, with the highest values coming from dairy production systems, more specifically cow’s milk (1.18 – 54 m2/ L of milk6).
In the group of plant-based milk, the highest value of land use comes from oat milk (0.66 m2/l), followed by soy milk (0.66 m2/l), almond milk (0.50 m2/l), and lastly rice milk (0.34 m2/l) (Silva and Smetana7).
Kanyama found that soy drink used 8% of the land required to produce the same amount of dairy milk on average. The variation in land use was large in this study: 0.7–242.1 m2/L for dairy milk and 0.3–1.7 m2/L for soy drinks.
2.2.4 Greenhouse Gas Emissions
The release of Greenhouse Gas emissions (GHG) from agriculture is primarily CO2, CH4, and N2O, these are released from various points in the life cycle. In 2020 New Zealand’s gross GHG emissions were 78.8 million tonnes of carbon dioxide equivalent (Mt CO2-e). Out of this 78.8 MT, 44% was Carbon Dioxide (CO2), 44% Methane (CH4), 11% Nitrous Oxide (N2O), and 2% Fluorinated gases (NZ Greenhouse Gas Inventory8). The agricultural sector contributed 50% of the gross emissions, with the energy sector the second highest contributor with 40%.
Table 2 shows the results from 11 different LCA studies on the GHG emissions from a range of different milk products.
.jpg?v=1675285549881)
Table 2 - Greenhouse Gas life cycle emissions of different types of milk (kg CO2 -eq/L of milk)
All 11 studies show that plant-based milk have lower GHG emissions when compared to dairy based milk. Processing was the main contributor of GHG for Almond, Pea, Soy, and Oat milk, compared to dairy milk1 7 which had 9% contributed by processors on average. Dairy milk emissions are mostly due to low feed conversion efficiencies, enteric fermentation in ruminants, and manure-related emissions. The processing part of dairy milk and plant-based drinks in some parts could be similar i.e., pasteurization and homogenization (Silva, B., & Smetana S. 2022), which can be seen in the results, with similar GHG emissions from producers across the plant-based studies.
2.2.5 Biodiversity
Only one study (Chaudhar18) found and quantified the land use impact on biodiversity. This was to show that if biodiversity is neglected, especially in the early stages of LCA’s, it can result in a significant underestimation of their total environmental impacts. Areas that have been heavily converted from their natural state in the past i.e., with small remaining natural areas, had higher factors indicating biodiversity damage per unit of area of land use. This includes regions with annual crops and urban land use, which generally had the highest factors (low biodiversity), compared to forestry, pasture, or permanent crops.
2.2.6 Conclusion
Oat milk has been found to have a lower environmental impact compared to dairy milk. The life cycle assessments that were used to assess the overall environmental impact have ranging methods used in their assessments and therefore can only be used as a guide when compared against each other. In the majority of instances, plant-based milk has a lower environmental impact when compared to dairy. In water use Almond milk uses significantly more water compared to dairy and other plant-based milk. More research into biodiversity and soil impacts needs to be completed, especially for plant-based products.
2.3 Poore’s multi indicator global database report.
Poore’s19 meta-analysis has combined the results of 1,530 LCA studies, which has been supplemented by additional data from 139 authors, into primary production from across the globe. The study reports the result of the five important environmental impact indicators land use; freshwater withdrawals weighted by local water scarcity; and GHG, acidifying, and nutrient emissions. The environmental impacts were reported for each stage of the supply chain. Poore found that the farm stage dominates the environmental impacts representing 61% of food’s GHG emissions (81% including deforestation), 79% of acidification, and 95% of nutrient loss and that “today’s agricultural system is also incredibly resource intensive, covering 43% of the world’s ice- and desert-free land. Of this land, 87% is for food and 13% is for biofuels and textile crops or is allocated to nonfood uses such as wool and leather.” Poore found that his results within the product categories were highly variable and skewed.
He found that:
* Within the major growing areas for cereal crops that land use was less variable but for all the other factors the results were highly variable. This variability suggests that there is substantial potential to reduce the environmental impacts of the food production systems.
* Across all products, 25% of producers contribute on average 53% of each product’s environmental impact. For scarcity-weighted freshwater withdrawals, the skew is particularly pronounced: Producing just 5% of the world’s food calories creates 40% of the environmental burden.
When Poore tested the impact of a range of practices (n-9) to reduce the environmental impact he found that only two, changing from monocultural production to diversified cropping and improving degraded pasture showed a statistically significant reduction in both land use and GHG emissions. He found that “reducing impacts means focusing on different areas for different producers and, by implication, adopting different practices.” His study found that the one size fits all approach to mitigation of the impacts is not appropriate in the vast majority of cases.
He found that “Providing producers with multiple ways to reduce their environmental impacts recognizes the variability in sources and drivers of impact but requires a step change in thinking: that practices such as conservation agriculture or organic farming are not environmental solutions in themselves but options that producers choose from to achieve environmental targets.”
He also found that “Though producers are a vital part of the solution, their ability to reduce environmental impacts is limited.”( our highlight) And that “We find that the impacts of the lowest-impact animal products exceed average impacts of substitute vegetable proteins across GHG emissions, nutrient loss, acidification (excluding nuts), and frequently land use. These stark differences are not apparent in any product groups except protein-rich products and milk.”
In discussing the ability for producers to meet reduction targets he notes that “numerous sources contribute to variance. Most notably, for all crop calorie production globally, differences in fallow duration and multiple cropping drive 40% of the variance in land use. This is important as most strategies to increase productivity are focused on increasing single crop yields. But for many producers, increasing cropping intensity through the use of early-maturing varieties, intercropping, catch crops, and enhanced irrigation can provide more economically viable and trade-off–free ways to boost productivity and reduce impacts.
Providing producers with multiple ways to reduce their environmental impacts recognizes the variability in sources and drivers of impact but requires a step change in thinking: that practices such as conservation agriculture or organic farming are not environmental solutions in themselves but options that producers choose from to achieve environmental targets.
In the section where he discusses producer limitation, and the role of consumers can play he says:
"Though producers are a vital part of the solution, their ability to reduce environmental impacts is limited. These limits can mean that a product has higher impacts than another nutritionally equivalent product, however it is produced. In particular, the impacts of animal products can markedly exceed those of vegetable substitutes to such a degree that meat, aquaculture, eggs, and dairy use 83% of the world’s farmland and contribute 56 to 58% of food’s different emissions, despite providing only 37% of our protein and 18% of our calories. Can animal products be produced with sufficiently low impacts to redress this vast imbalance? Or will reducing animal product consumption deliver greater environmental benefits?"
He ponders whether: procurement could source from low-impact farms. And that alternatively if higher prices for sustainable production incentivized low-impact producers to increase output or high-impact producers to change practices. The case of organic food shows how passing premiums to consumers limits total market size and widespread practice change.
He then goes on to construct a framework which represents the possible range of mitigation possibilities.
.jpg?v=1675285615082)
Figure 1: Poore’s Graphical representation of the mitigation framework.
He concludes from this framework that Today, and probably into the future, dietary change can deliver environmental benefits on a scale not achievable by producers. Moving from current diets to a diet that excludes animal products has transformative potential, reducing food’s land use by 3.1 (2.8 to 3.3) billion ha (a 76% reduction), including a 19% reduction in arable land; food’s GHG emissions by 6.6 (5.5 to 7.4) billion metric tons of CO2eq (a 49% reduction); acidification by 50% (45 to 54%); nutrient loss by 49% (37 to 56%); and scarcity-weighted freshwater withdrawals by 19% (−5 to 32%) for a 2010 reference year.
In summary he concludes that in adopting his framework the following outcomes would be seen:
* Producers would monitor their impacts using digital tools. Data would be validated against known ranges for each value (e.g., maximum yields given inputs) and validated which would support producer-led innovation.
* Impacts would be communicated up the supply chain and through to consumers.
* Consumers would then drive reductions in the five areas of concern by making their choices in buying the products which gave the least amount of environmental degradation.
3 Regenerative Agriculture
TAG were asked to suggest a proposal of how oat production can fit into a regenerative agricultural system.
3.1 The definition of what constitutes a regenerative agricultural system.
In a think piece20 funded by Our Land and Water Toitū te Whenua, Toiora te Wai National Science Challenge (OLW)21 the authors recognise that the concept of regenerative agriculture in terms of its definition are fluid and are numerous and depend very much on the place and culture which they are considering it in. They describe it as a grass led movement and state that:
"Underpinning the movement is a vision of agriculture that regenerates the natural world while producing ‘nutrient-dense’ food and providing farmers with good livelihoods. There are a growing number of farmers, NGOs, governmental institutions, and big corporations backing RA as a solution to many of the systemic challenges faced by humanity, including climate change, food system disfunction, biodiversity loss and human health (to name a few). It has now become a movement. Momentum is building at all levels of the food supply and value chain."
In a companion piece of work22 they sought to elicit the views of a range of contributors as to on what makes a system regenerative and what outcomes a system needs to achieve to be regenerative. In the discussion on the results of this exercise they report that:
"The contribution of RA to social well-being was the theme most mentioned by participants across the entire dataset (i.e. by all sector working groups), with soils the second most discussed theme. The latter reinforces the strong focus RA has on soil health (Schreefel et al. 2020). There was also a strong emphasis on access to market for the sheep & beef and arable sector participants, and on production, profitability & productivity for the viticulture sector participants."
The themes that they identified as making a system regenerative are shown in Table 3.
.jpg?v=1675285630002)
Table 3: Themes identified from sector working groups on what makes a system regenerative.
They then were able to further describe what elements of the farming system contribute to best practice in terms of regenerative agriculture. These descriptions are shown in Table 4.
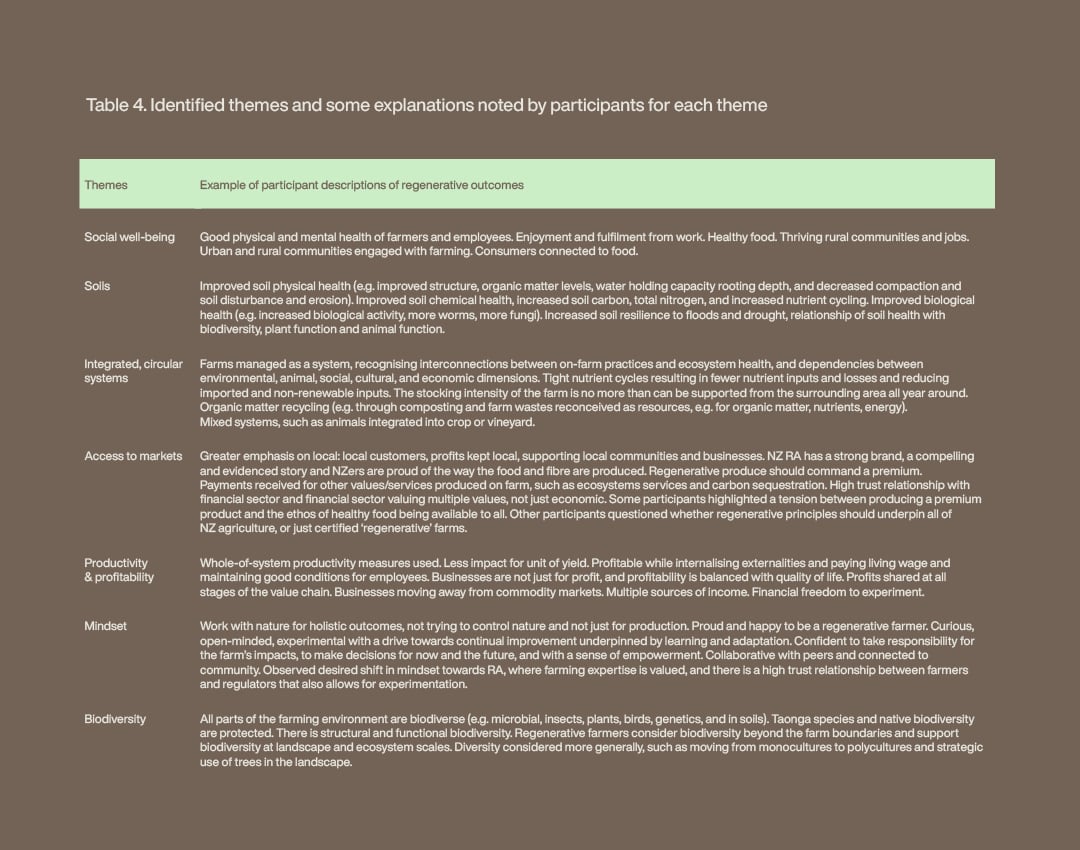
Table 4: Identified themes and some explanations noted by participants for each theme
What we can see from Table 4 is that the concept of regenerative agriculture is more of a loose theory about what is a worthwhile farming philosophy that is going to result in the farming system being more sustainable rather than the sort of strict adherence to a set of practices as we find within the organic or bio grow industries.
The sector groups were then asked to contribute to an analysis of what works in New Zealand and what doesn’t and a comparison from overseas. The results for the Arable and Dairy sections are reported in Table 5.
.jpg?v=1675285672506)
Table 5: What works well in New Zealand
.jpg?v=1675285683546)
Table 6: What doesn’t work well in New Zealand.
Participants from the arable sector thought NZ systems performed at least as well as, or better than, overseas systems. This was due to:
* favorable environmental conditions (weather, soils, water)
* no long history of soil degradation
* diverse cropping rotations integrated with livestock
* good market access in many parts of the world
* willingness to try novel crops
* some added value, rather than only being commodity driven
* great farmers with deep connections to the land and a sense of stewardship.
Dairy participants gave a mixed response, with some thinking NZ systems outperform overseasand some thinking they do not. In terms of performing better, the reasons noted were:
* high efficiency
* lower-intensity farm systems
* use of grass-based system, with a high proportion of feed grown on the farm
* the use of legume-grass pastures
* a benign climate
* good infrastructure
3.2 Conclusion
We conclude that it would be relatively easy for an oat production system to fit into a regenerative farming framework as long as the farmer was willing to set up his system to achieve the themes identified in Table 3 and the descriptions that are provided in Table 4. We are not of the opinion that this would be an arduous or difficult task for the majority of oat growers who are already achieving a lot of the themes within their current systems.It is our opinion that concentrating on matching the application of Nitrogen fertiliser to the plants actual demand and minimising the impact of the loss of carbon from cultivation are the two most important elements from a cropping perspective to achieve the ability to fit into a regenerative framework.
4 Modelling
We have modelled four environmental impact indicators:
* land use (litre / m2)
* GHG ( T CO2 eq / ha)
* Phosphorus Loss ( kg P / ha).
As there isn’t any water abstracted from either surface or ground water in any of the systems modelled in Southland this environmental impact indicator hasn’t been reported. We have modelled the four systems using Overseer.
Overseer only reports the GHG indicator for the whole farm system. We have carried out GHG modelling of growing oats alone using the Cool Farm Tool GHG Calculator23 which is able to give us an idea of the impact of oats as a stand alone crop but we would point out that within the New Zealand farming context it is generally grown as part of a rotation. The nitrogen loss that is reported in Overseer is measured at the 60 cm level below the ground surface. This means that it is a measure of the potential for it to cause nutrient loss. There are a lot of factors that are at play which will determine whether the nitrogen will in fact end up causing contamination of a water way.
4.1 The systems modelled.
There are five farm systems modelled;
* An intensive arable system,
* A Southland mixed arable/ livestock system Autumn sown,
* A Southland mixed arable/ livestock system Spring sown,
* A Southland dairy farm system,
* A dairy farm system plus 10% oats.
(A brief description of each system is in Appendix A.)
4.2 Results
4.2.1 Land Use
As can be seen from Table 7 the land use of oats is far more efficient in output than dairy is when considered on a per litre of output basis.
.jpg?v=1675285698110)
Table 7: Land Use (m2 / l )
4.2.2 Green House Gas
The GHG results that are taken from Overseer are reported in Table 8. The results are expressed as both Tonnes / ha and as kilograms / litre. The results of modeling of a crop of oats alone in the Cool Farm Tool GHG Calculator (which is a simplification of the way that the GHG calculation is carried out in Overseer) shows emissions of 2.51 T CO2 eq / ha which approximate the results that are gained from the Overseer whole farm system results.
The farming of the oat systems are obviously much lower than the dairy systems for GHG emissions on both of the comparator metrics used.
.jpg?v=1675285721095)
Table 8: Green House Gas (CO2 eq)
4.2.3 Nutrient loss
The results of the losses of Phosphorus that were gained from modeling the farm systems in Overseer are in Table 9. We haven’t included the results of the Nitrogen losses because in Overseer in the Intensive Arable system the crop is sown by direct drilling and in the two mixed arable / livestock systems although they are modelled differently, with the Autumn sown modelled as cultivation being by the traditional method of working the soil into a seed bed and in the Spring sown it is modelled as direct drilled. In Overseer currently, although you can stipulate the different cultivation methods the modelling tool is not able to model them differently in terms of the mineralisation of N and adopts the traditional cultivation method for each option. Therefore, we were not able to demonstrate the lower losses of Nitrogen that we know happens when the crop is direct drilled.
We are currently involved in a research project which is designed to demonstrate the Nitrogen losses from direct drilling versus conventional cultivation which is going to be modelled in APSIM which is an alternative tool for modelling nutrient losses which is able to accurately depict the impact of the direct drilling method. We would expect to be able to comment on the impact of direct drilling when we have the results from that trial.
The loss of P is lower in the arable systems than in the livestock systems.
.jpg?v=1675285733420)
Table 9: Nutrient loss (P / ha)
5 Financial
The five farm models have each been converted into financial models. The arable models have all be created from a standard Arable farming model which was created for some work which was carried out for MFE by TAG. The dairy model used the Southland dairy model which was an adaption of an old MPI Dairy Farm Monitoring model for Southland. This model was updated to reflect the average dairy farm area, cow numbers and production per cow as expressed in the DairyNZ Economic Survey 2019/20.
The parameters that were used in the Overseer modelling have been used in the financial modelling.
The results of the financial modelling are shown in Table 10.
Things to note from the financial analysis are:
* The Intensive arable model is the highest returning of the arable models because of the higher proportion of higher returning crops than livestock.
* The Autumn sown arable model has higher returns than the Spring sown because the higher returns from the crops in that model outweigh the higher returns from livestock.
* The straight Dairy model is twice the return of the highest earning arable model with the Dairy / Oats model being almost 50% higher.
* The considerable higher returns from Dairy mean that the only justification for combining this land use with oats would be the reduction in GHG.
.jpg?v=1675285745456)
Table 10: Results of financial analysis ($)
Appendix A: Overseer
Overseer24 describes itself as a way to estimate how nutrients are cycled within a farm system. This allows the user to better understand annual average nutrient requirements and the likely effects of changing management practices on the farm’s overall nutrient inputs and losses.
To achieve this OverseerFM is made up of a set of science models and components that work together to model nutrient flows including greenhouse gas emissions for a farm system.
Overseer is made up of a set of sub models and components that work together to model nutrient flows and GHG emissions for a farm system.
The complicated array of models and how they combine to give the results is shown in Figure 2.
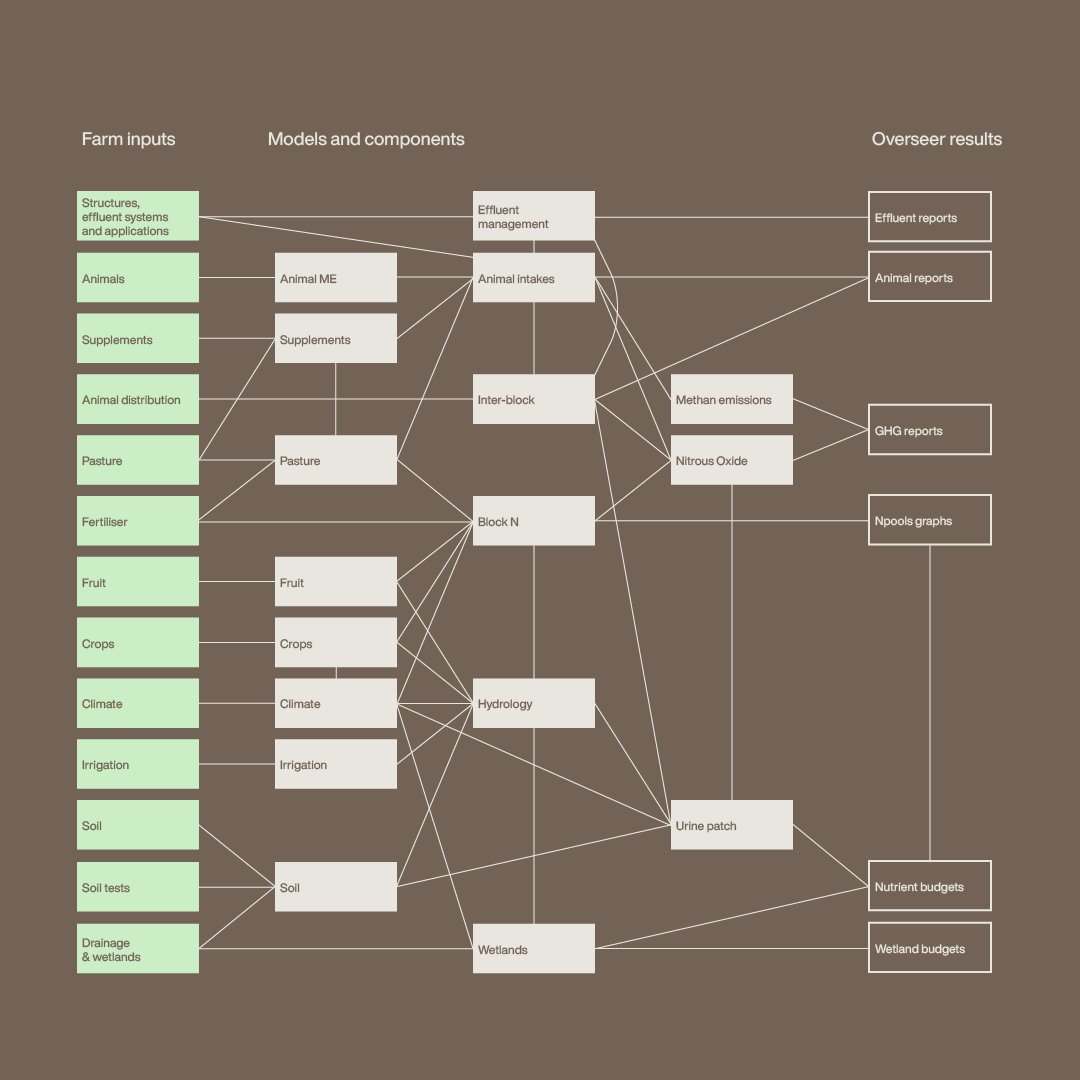
Figure 2: A description of how Overseer incorporates inputs into its various models which then report the results.
On crop blocks, the crop rotations are entered for 24 months and so the previous year may be different to the reporting year. The crop block history is used because residue decomposition from the previous crop can carry over into the reporting year. The end month of the cycle may be defined for each crop block. This enables the entry of complete cropping cycles (through to harvest) so the model can capture the entire effect of the crop. Nitrogen is added through rainfall, irrigation, fixation, fertiliser, effluent and from decomposition of resident organic matter and residues. Nitrogen is removed via volatilisation, denitrification, leaching and nitrogen uptake of the plants.
This means that for any crop the actual amount of Nitrogen leached is driven by the amount of Nitrogen left in the soil from the previous crop, the amount recovered by the denitrification of organic matter, the amount of Nitrogen applied in fertiliser, the amount taken up by the growing plants and is further affected by the amount of rainfall or irrigation and the soils nitrogen leaching vulnerability.
.jpg?v=1675286067957)
Appendix B: Description of the models.
2Silva et al. (2021). Differences in Environmental Impact between Plant-Based Alternatives to Dairy and Dairy Products: A Systematic Literature Review.
3J. Poore, T. N. (2019). Reducing food's environmental impacts through producers and consumers. Science.
4Tilan, D., Clark, M. (2014). Global diets link environmental sustainability and human health. Nature.
5Buchan, L. H. et al (2022). Ripple Milk life cycle assessment.
6Tilan, D., Clark, M. (2017). Comparative analysis of environmental impacts of agricultural production systems, agricultural input efficiency, and food choice. Environmental Research letters.
7Silva B Q, Smetana S. (2022). Review on milk substitutes from an environmental and nutritional point of view.
8Environment, M. f. (2022, April 12). New Zealand's Greenhouse Gas Inventory 1990-2020 Snapshot.
9Kiara Winans, I. M.-S. (2019). Life cycle assessment of California unsweetened almond milk. LCA for energy systems and food products.
10Clune S, Crossin E, Verghese K (2017) Systematic review of greenhouse gas emissions for different fresh food categories
11Florén B, Nilsson K, Wallman M (2013) LCA on fresh and aseptic oat drink, Swedish Institute for Food and Biotechnology
12Grant C, Hicks A (2017) Paper presented at ISIE-ISSST 2017: science in support of sustainability and resilient communities.
13Henderson A, Unnasch S (2017) Life cycle assessment of ripple non-dairy Milk. Life cycle associates LCA.
14Thoma G, Popp J, Nutter D, Shonnard D, Ulrich R, Matlock M, Kim DS, Neiderman Z, Kemper N, East C, Adom F (2013) Greenhouse gas emissions from milk production and consumption in the United States: a cradle-to-grave life cycle assessment circa 2008. Int Dairy.
15Granarolo (2016) Dichiarazione ambientale di prodotto della bevanda UHT di soia Granarolo 100% vegetable. Granarolo Group, Bologna.
16Mikkola, M., Risku-Norja, H. (2008). Institutional consumers’ views of GHG emission reduction by optional milk systems within sustainability frame.
17We assume that the dairy milk in this instance is processed to a whole milk state rather than to milk powder.
18Chaudhary, F. V. et al. (2015). Quantifying Land Use Impacts on Biodiversity: Combining Species−Area Models and Vulnerability Indicators. Environmental Science and Technology, 9987-9995.
19Poore et al. (2019). Reducing food’s environmental impacts through producers and consumers.
20Grelet GA, Lang S 2021. ‘Think piece’ on Regenerative Agriculture in Aotearoa New Zealand: project overview and statement of purpose. Manaaki Whenua – Landcare Research Contract Report LC3954 for Our Land and Water National Science Challenge & The NEXT Foundation.
21https://ourlandandwater.nz/project/regenerative-agriculture/
22Grelet GA, Robson-Williams M, Price R, Kirk N, Horrocks A, Fraser T, Barry M, Mellor R, Buckler M, Kerner W, O’Connell S, Griffin F. 2021. Perspectives on ‘regenerative outcomes’ and associated research needs: insights from consultation with participants in four sectors – arable, dairy, sheep & beef, and viticulture. Manaaki Whenua – Landcare Research Contract Report LC3954-5 for Our Land and Water National Science Challenge & The NEXT Foundation.
23https://app.coolfarmtool.org/account/login/?next=/
24https://www.overseer.org.nz
Please Read
The information in this report is accurate to the best of the knowledge and belief of the consultants acting on behalf of Leftfield Innovation Ltd for Boring Oat Milk . While the consultant has exercised all reasonable skill and care in the preparation of information in this report neither the consultant nor Leftfield Innovation Ltd for Boring Oat Milk accept any liability in contract, tort or otherwise for any loss, damage, injury or expense, whether direct, indirect or consequential, arising out of the provision of information in this report.